
“Big Data” has been a frequently-used term for many companies, however, is the value of big date fully exploited? Michael Li, Sr. Director of Business analytics at LinkedIn, Advisor for Start-ups and Universities, thinks that it has been used way more often for pure marketing purposes than for creating real value for businesses or people.
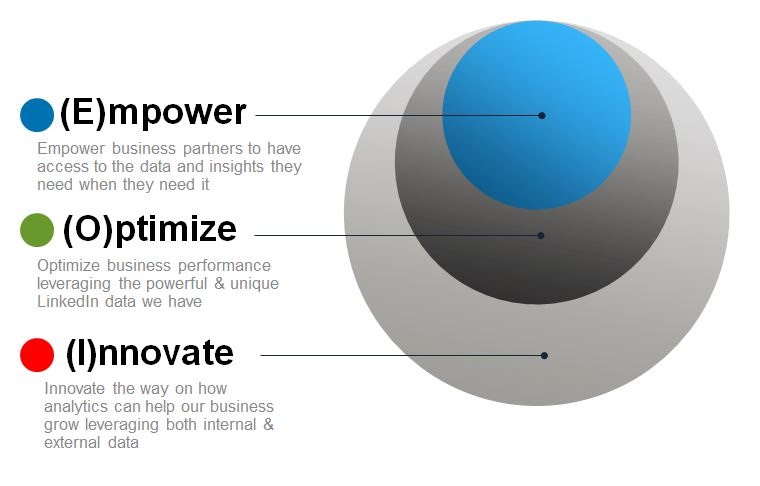
Here is the "EOI" analytics framework used by the Business analytics team at LinkedIn to continuously drive business value through the leverage of “Big data.”

“E” stands for Empower: Empower business partners to have access to the data and insights they need when they need them
The most common practice for this category is performing ad-hoc analyses based on the questions asked by the business partners: “How much money we made in the last week/month/year?”, “What are the key drivers for the big year-over-year drop in one of the key business performance metrics?”, etc. This is probably how the majority of people understand what “analytics” is, and it’s truly important for businesses, as it empowers decision makers to make data-driven decisions (or at least consider making them).
Many analytics teams today spend most of their time in this category. Over time, analysts perform similar analyses multiple times and get more efficient and productive. However, the issue is that analysts may also get bored by doing similar analyses over and over again, and it’s not scalable for companies to hire expensive talents to do work that is repetitive in nature.
The key to solving this issue is to create leverage—to automate and simplify processes, such as data pipelines, data cleaning, convert data into certain format, through technology as much as possible, so that you spend more time focusing on the more exciting pieces: finding insights and making recommendations to business partners.
“O” stands for Optimize: Optimize business performance by leveraging the powerful and unique data.
This category includes more advanced analytics work such as hypothesis-driven deep dive analyses, marketing campaign targeting, and propensity models that help answer questions like what will happen if we do this, or what is the best that could happen? Although these analyses typically take more time to carry out, they also bring in a greater return on investment (ROI) to the business side. More importantly, they almost always need to start from the knowledge and foundation built through the “Empower” process through which analysts can understand the nature of the data and connect it with business needs.
“I” stands for Innovation: Innovate the way analytics can help business grow by leveraging both internal and external data.
In Silicon Valley, innovation is a word that gets everyone excited. There are many ways for analytics teams to be innovative, and the ultimate measure of an analytics team’s success in innovation is the business impact it has. When we evaluate the potential for an “innovation” or venture project, they look at the potential business impact it will have in the next 1–3 years, mostly in terms of incremental revenue/profit or user engagement/page views.
Since I have been advocating for this framework, I am often asked the question, “What is the right allocation of resources for the EOI framework?” The truth is, depending on the evolution of the analytics team, you may have to have a different distribution curve for the analytics resources that you spend on EOI; the key is to make sure you have at least meaningful investment in each category and a reasonable macro allocation that you believe works best for the current stage of the business.
In general, based on my discussions with many of my analytics peers in the industry, I’d expect for us to see %E > %O > %I more often, especially for companies that are growing at double figures every year.
Day|Week

 Six Luxury Sports Cars Totaled after Fail Attempts to Cross China’s Most Perilous Highway Linking SW China’s Sichuan and Tibet
 Incredible Transformation: “Witch Child”Whose Parents Left Him for Dead in Nigerian Makes Speedy Recovery
 Kenyan woman's crappy photoshopped pictures make her a web celebrity
 Magnificent view of E. China's Anhui province
 Global landmarks captured in striking shots
 Thailand Elephants Disguised as Pandas Sparks Debates
 College girl dresses as mermaid to mark World Water Day
 J-15 fighters in drill on Chinese aircraft carrier
 96-Year-Old Veteran Becomes Fashion Icon
 Creative mother produces 232 unique breakfasts